What counts as the “latest” balance sheet?
Bharti Airtel’s most recent audited balance sheet is part of its FY25 Integrated Report and Annual Financial Statements (year-end: 31 March 2025). It’s the cleanest source for a full, line-by-line view of assets, liabilities, and equity. For a “right-now” pulse, Airtel’s Q1 FY26 investor pack (as of 30 June 2025) gives a summarized balance sheet and net-debt schedule. I’ll lean on the audited FY25 numbers for structure, then use Q1 FY26 to note early trends.
The big picture: a bigger, heavier balance sheet
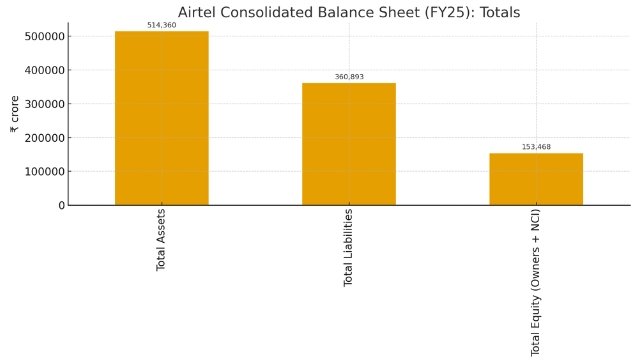
At FY25 year-end, total assets stood at ₹5.14 trillion (₹5,14,360 crore), up ~16% from FY24’s ₹4.45 trillion. Total liabilities rose to ₹3.61 trillion (₹3,60,893 crore), while total equity (owners + NCI) climbed to ₹1.53 trillion (₹1,53,468 crore). Equity attributable to Airtel’s owners alone was ₹1.14 trillion (₹1,13,672 crore), up ~39% year on year. In short: a materially larger balance sheet with a stronger equity cushion.
Two forces dominate the year’s story:
- Indus Towers moves inside the tent. Airtel consolidated Indus Towers in FY25 (step acquisition), which materially reshaped the asset and liability mix. On a provisional basis, this recognition created ~₹2.09 lakh crore of goodwill and brought Indus’s sizable PPE, lease liabilities, and payables onto Airtel’s books.
- Capex and spectrum-heavy intangibles. Telecom balance sheets skew toward long-lived assets. Airtel’s FY25 shows hefty increases in PPE, right-of-use (ROU) assets, and intangible assets (notably spectrum).
Assets: where Airtel is putting capital to work
Non-current assets rose to ₹4.47 trillion, from ₹3.86 trillion—roughly 87% of the asset base, as you’d expect for a network business. The standout lines:

- Property, plant & equipment (PPE): ₹1.43 trillion, up ~34% YoY (vs. ₹1.07 trillion). Indus consolidation and ongoing India/Africa network investments fortify this bucket. About 27.9% of total assets are tied up in PPE.
- Right-of-use assets: ₹0.60 trillion, up from ₹0.56 trillion—reflecting long-term site/tower leases fundamental to telecom.
- Intangible assets: ₹1.33 trillion, up from ₹1.14 trillion, largely spectrum and software. Spectrum remains the lifeblood of throughput and pricing power.
- Goodwill: ₹0.52 trillion (₹51,697 crore), ~95% higher than FY24, driven predominantly by the Indus step acquisition accounting. This is not “hard” asset capacity but the premium paid for expected synergies and earnings power.
- Investments in JVs & associates: ₹36,416 million, down from ₹312,404 million, because Indus moved from “associate” to consolidation—so that stake no longer sits here; its underlying assets and liabilities sit across the balance sheet.
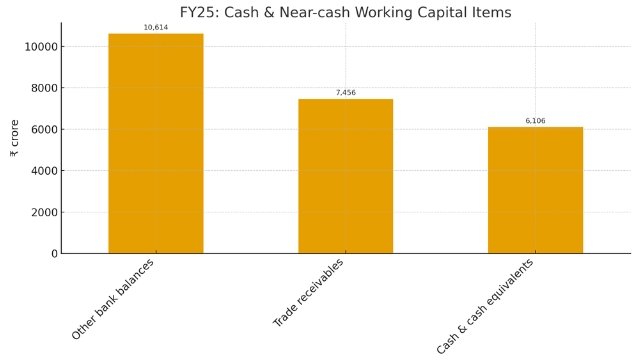
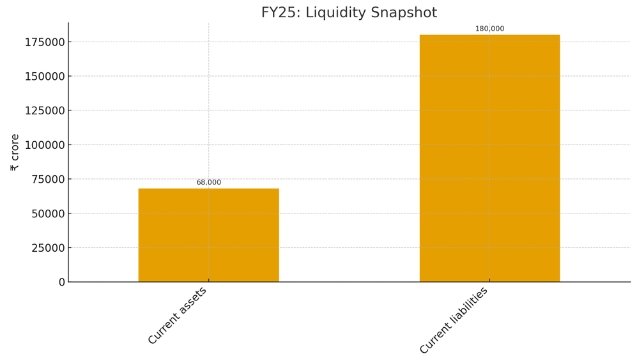
Current assets climbed to ₹0.68 trillion. Within that, trade receivables increased to ₹74,557 million (vs. ₹47,277 million), and other bank balances to ₹106,143 million (vs. ₹94,244 million). Cash & cash equivalents actually dipped to ₹61,056 million (vs. ₹69,155 million), which matters when you consider near-term obligations (more on that below).
Liabilities: the cost of building and running a massive network
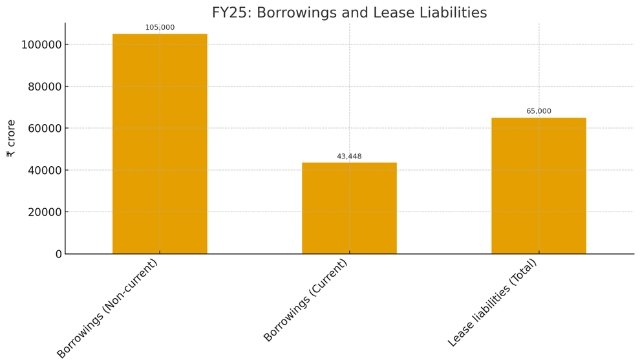
Non-current liabilities eased to ₹1.80 trillion (from ₹2.00 trillion), as non-current borrowings dropped to ₹1.05 trillion (from ₹1.31 trillion). Offsetting, deferred tax liabilities climbed sharply to ₹93,549 million (from ₹25,118 million)—typical when fair-value adjustments (like Indus) flow through. ROU lease liabilities remain hefty at ₹0.56 trillion, reflective of site infrastructure economics.

Current liabilities swelled to ₹1.80 trillion (from ₹1.39 trillion). Key drivers:
- Current borrowings: ₹434,485 million (vs. ₹209,539 million)
- Trade payables: ₹381,537 million (vs. ₹351,325 million)
- Other financial liabilities: ₹333,024 million (vs. ₹253,456 million)
- Provisions: ₹361,552 million (vs. ₹283,282 million)
These moves reflect timing effects (including Indus consolidation), rolling maturities, and the working capital rhythm of a scaled operator.
Lease liabilities (total)—combining non-current and current—are about ₹0.65 trillion. That’s the other “invisible” debt-like commitment typical for tower/site access under Ind AS-116.
Leverage & liquidity: how stretched is Airtel?
A simple snapshot using FY25 year-end:
- Borrowings (current + non-current): ~₹1.48 trillion
- Total equity (owners + NCI): ~₹1.53 trillion
- Debt-to-equity (borrowings ÷ equity): ~0.97×
- Current ratio (current assets ÷ current liabilities): ~0.37×
Telecoms routinely run negative working capital because subscription cash flows are steady and vendor terms are long; still, the low current ratio underscores why access to funding markets and stable operating cash flow are crucial. (Figures from FY25 audited consolidated balance sheet.)
Airtel also reports a net-debt schedule in its IR pack. As of June 30, 2025, net debt excluding leases was ₹1.255 trillion, down year-on-year (a positive), while net debt including leases was ₹1.916 trillion. The schedule breaks out deferred spectrum payment liabilities separately—a reminder of the sector’s structural capital intensity.
The Indus Towers pivot: why it matters to the balance sheet
Two things happened in FY25 that tie back to Indus Towers:
- Consolidation of Indus (from associate to subsidiary): Airtel recognized fair-valued assets and liabilities and ~₹2.09 lakh crore of goodwill as part of the step-acquisition accounting. This inflated goodwill and intangibles, while also pulling in Indus’s lease liabilities and payables, changing both the structure and scale of the balance sheet.
- Business transfer of passive infrastructure: Airtel executed a slump sale of its own passive infrastructure undertaking to Indus (a subsidiary post-consolidation), receiving consideration and transitioning to a long-term service arrangement. The notes describe timing and consideration flows; economically, this centralizes tower assets at Indus and leaves Airtel focusing on access via leases.
Net-net: the balance sheet got bigger and more lease-heavy, but operationally cleaner—Airtel is increasingly a network-and-services company renting a lot of the passive layer, rather than owning as much of it on-balance-sheet.
What the asset mix says about strategy
1) Spectrum and software (intangibles)
The ₹1.33 trillion in intangible assets is mostly spectrum. Spectrum payments often show up as deferred payment liabilities in the net debt bridge, effectively functioning like long-dated, quasi-secured financing tied to licenses. This is the capital backbone of ARPU growth strategies (more capacity → better speeds → pricing power).
2) Towers and leases
ROU assets at ₹0.60 trillion and lease liabilities at ~₹0.65 trillion capture the long-term site economics. Indus’s consolidation amplifies both—Airtel now reports more of this ecosystem within its perimeter. As 5G densification continues, expect lease lines to remain large (and relatively predictable).
3) PPE
At ₹1.43 trillion, PPE reflects fiber, radios, data centers (Nxtra), and the physical network layer. This is where “moat” lives. The growth tracks India capex and Africa modernization—and, again, Indus.
What the liability mix says about risk
1) Borrowings: term vs. near-term
Airtel reduced non-current borrowings in FY25 but increased current borrowings, which can be timing (reclassification as maturities approach) rather than an intent to permanently rely on short-term lines. Managing the ladder here—i.e., refinancing smoothness and cost—matters in a rate-sensitive world.
2) Leases are debt-like
Under Ind AS-116, leases look a lot like debt on the balance sheet. Combined with borrowings and spectrum payments, this underscores that Airtel’s enterprise value is capital-heavy by design. The counterweight is the recurring, subscription-like cash flow profile.
3) Deferred tax and fair-value effects
The jump in deferred tax liabilities connects directly to consolidation and fair-value accounting—a non-cash but real claim on future profits. It’s a reminder that M&A accounting can reshape equity and liability lines without changing day-one cash.
Early FY26 read-throughs (June 30, 2025)
Quarterly snapshots shouldn’t be over-interpreted, but two signals are useful:
- Total assets nudged to ₹5.15 trillion; equity (owners + NCI) to ₹1.61 trillion; total liabilities eased to ₹3.54 trillion—a small deleveraging from March, helped by cash generation and movements in working capital.
- Net debt (ex-leases) was ₹1.255 trillion, down YoY; net debt (incl. leases) was ₹1.916 trillion. This mix is consistent with steady funding of spectrum and towers while protecting liquidity.
What I’m watching next
- Operating cash flow vs. capex cadence. With 5G rollouts and fiber backhaul ongoing, capex discipline relative to EBITDA is key to de-risking the short-term borrowings bulge. (Q1 FY26 showed healthy operating free cash flow.)
- ARPU-led deleveraging. If India ARPU keeps drifting up and Africa maintains FX stability, net leverage should grind down, especially on a pre-lease basis.
- Indus synergy capture. Now that Indus is consolidated, watch for lease rate rationalization, site utilization, and working capital normalization to show up in payables, lease liabilities, and provisions trends over the next few quarters.
- Regulatory & spectrum liabilities. The mix of deferred spectrum payments in net debt keeps Airtel structurally tied to DoT schedules and auctions; smoother cash costs (and any tariff support) directly feed balance-sheet health.
Final Thoughts
Airtel exits FY25 with a larger, more lease-intensive balance sheet—a direct result of consolidating Indus Towers and continued spectrum-first investment. The equity base is materially stronger, borrowings are manageable against cash generation, and early FY26 shows stable to improving leverage metrics, especially on a pre-lease basis. The company remains a classic telco case: capital-heavy, cash-rich, and scale-moated. If ARPU, usage, and network quality continue to trend the right way, the balance sheet should gradually de-risk, even as it carries the weight of spectrum and towers.
Disclaimer:
This article is intended solely for informational and educational purposes. It should not be interpreted as financial, investment, accounting, or trading advice. The analysis presented here is based on publicly available financial statements and investor disclosures from Bharti Airtel at the time of writing. Corporate financial data, market conditions, and regulatory frameworks may change, and interpretations may vary. We are not registered with SEBI, RBI, IRDAI, or any other financial authority. Readers should independently verify all information and consult a qualified financial professional before making any investment or financial decisions related to Airtel or any other company.